This Issue
August 2026 edition
221 vs 408
Distinct operators recording a flip resale this edition, against the same two months a year ago
The flip operator field halved — 221 sellers vs 408 a year ago — while investor purchases held flat and gross margins widened
Flip resales fell to 285 from 604 a year ago, and the number of operators behind them fell to 221 from 408 — the field thinned about as fast as the volume. Flipper acquisitions dropped in step, 430 against 740. What did not thin was pricing: the median flip resale was $185,000 versus $179,950 a year ago, and median gross margin was $82,900 versus $79,250, on a median 191-day hold. Meanwhile total investor purchases were 2,022 versus 2,033 — the buy side is intact; the resale cohort is not.
Investor Playbook
What this issue's numbers suggest checking, by investor type. Observations from recorded data — not investment, legal, or tax advice.
Fewer flip buyers on the list — price to landlord math
Wholesalers
Flipper acquisitions ran 430 against 740 a year ago, and recorded assignments surfaced at 7 with a $19,575 median spread versus 20 at $36,250. The data suggests thinner rehab demand for contracts; worth testing dispositions against buy-and-hold buyers in the $45,000-$67,500 basis zips (44105, 44108, 44128) where investor purchase counts stayed high. Wholesale counts are a floor — only assignments touching a recorded deed appear.
Less competition at the same exit price
Flippers
221 operators recorded exits versus 408, while the median resale held at $185,000 against $179,950 and median gross margin came in at $82,900 versus $79,250 on a 191-day median hold. Margins here are gross — rehab and carry are not public record. Worth checking 44120 and 44102, the two zips that gained the most flip share this period, where median buys were $67,500 and $115,000.
The 2-4 unit basis gap is the widest line in the buy data
Landlords
Small multi traded at a $103,000 median and $51/sqft this period against $135,050 and $108/sqft for single family, and $189,900 and $167/sqft for condos. With 277 recorded small-multi purchases, supply exists at that basis. The data suggests the per-foot gap, not the headline price, is where the yield case sits.
The small-balance rehab slot is thinly filled on record
Private lenders
Recorded private loans totaled 8 at a $59,000 median, versus 56 at $100,000 a year ago, while over the trailing 12 months 53.7% of observed investor purchases carried financing and 56% of those 1,234 loans funded rehab. Named lenders skew larger: Kiavi at a $150,500 median loan and 1.30 loan-to-price, RFLF 4 at $166,000. Worth checking demand under $100,000 against a $110,200 trailing-12-month market median.
Apartment 5+ still clears near $52/sqft
Multifamily investors
Forty apartment 5+ purchases recorded at a $340,500 median and $52/sqft, essentially the same per-foot level as unspecified multi-family at $51/sqft. Flip resales of multi-family product were only 33 deals at $18/sqft, so exits through the rehab channel are scarce; the data suggests underwriting to hold rather than to a flipper takeout.
Factoids
Numbers from this period a practitioner would repeat to a colleague. Each computed directly from recorded instruments.
$140,000 — Median investor purchase price this edition
trending down · was $152,000 a year ago
Acquisition basis is running below last year's level even though deal count is flat at 2,022 versus 2,033. The prior-period median was $133,710.
17.9% — Share of flip resales that were small multi-family
trending up · vs 14.9% a year ago
The shrinking resale cohort is slightly more weighted to 2-4 unit product. Pre-1950 stock also rose to 60.1% of flips from 57.3%.
6.3% of flips — 44120 (Shaker Square / Buckeye) share of flip resales
trending up · vs 2.5% a year ago
The largest zip-level share gain in the period; 44120 also logged 18 flips and 75 investor purchases at a $67,500 median buy against a $122,500 median sale.
8 private loans — Recorded private loans this edition, median $59,000
trending down · vs 56 a year ago at a $100,000 median
Recorded private lending has nearly vanished from the deed record while institutional rehab lenders remain active. Loan terms are not recorded and are not published here.
73 seller-financed notes — New notes held, median $125,000
trending up · vs 55 a year ago, median $115,000
Seller paper is the one financing line still growing year over year, up 33%. It is now the more common recorded alternative to bank debt in this market.
7,382 units — Estimated flip pipeline inventory in the latest month
trending down · vs 8,122 in the same month a year ago
Held stock keeps draining: 240 resold and 114 aged out of the pipeline in the latest month, against 270 bought. Latest-month counts can still grow up to about 15% as late records arrive.
Market Activity — Investor Purchases
Monthly count of investor purchases of MSA properties (left axis) and the median purchase price (right axis), trailing 13 months. The most recent month can grow up to ~15% as late recordings arrive.
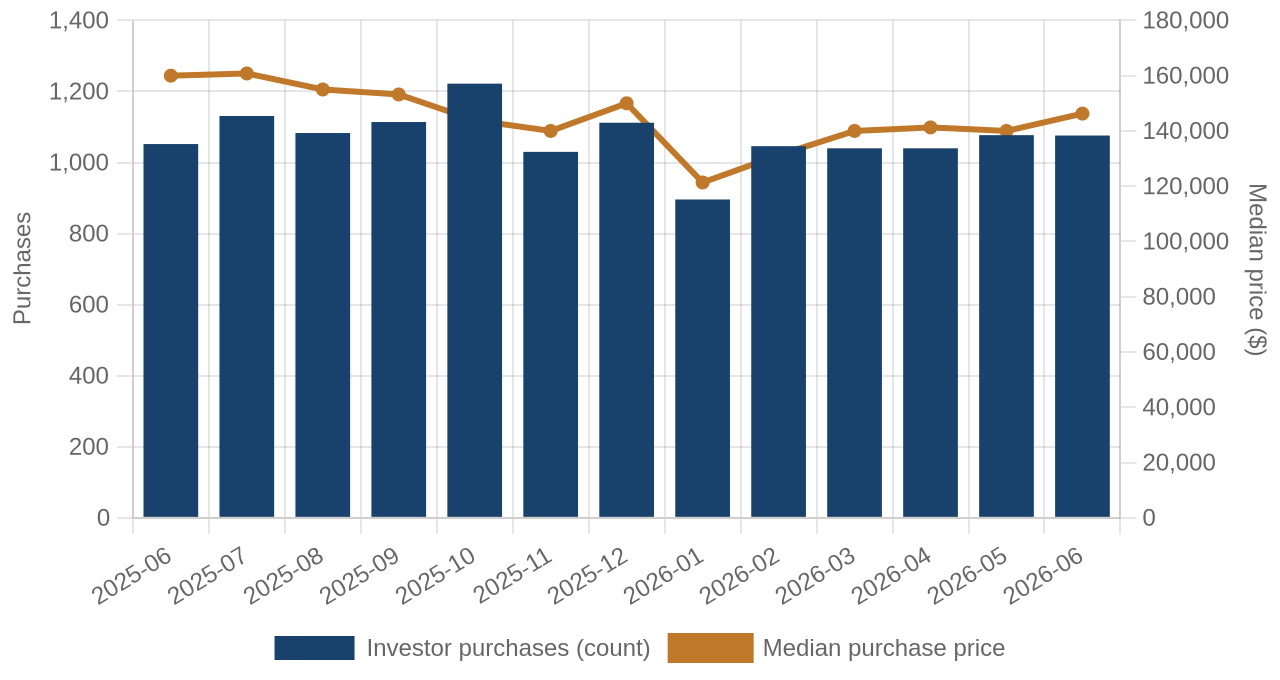
Investor purchases per month (bars) and median purchase price (line), trailing 13 months.
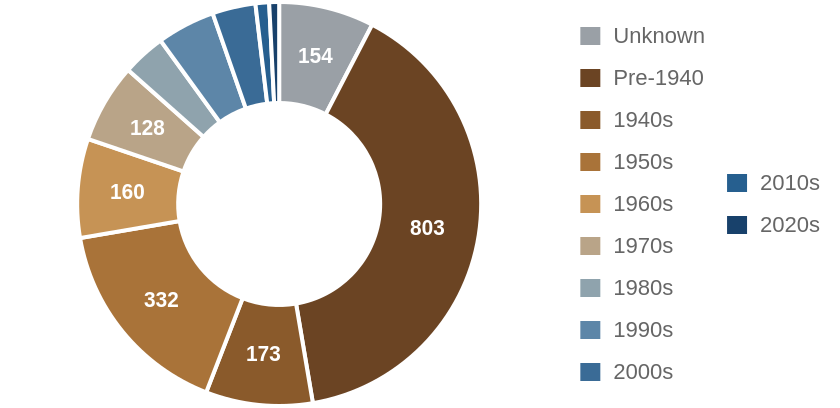
Which vintage of housing investors bought this edition, by decade built.
Where the Money Went
The geography of the period's investor activity: which zip codes saw the most recorded deals, and the largest individual transactions at street level.
The 8 busiest zip codes for investor deals
Pins rank the busiest zips by recorded investor deals (purchases + flips of existing homes) this period — #1 busiest; orange = top 3; pin size scales with deal volume. Median buy is the typical investor purchase; median sale the typical flip resale. Click a pin for details; full table below.
| # | Zip | Area | Purchases | Flips | Median buy | Median sale |
|---|
| #1 | 44105 | Slavic Village / Union-Miles | 111 | 17 | $45,000 | $120,000 |
| #2 | 44120 | Shaker Square / Buckeye | 75 | 18 | $67,500 | $122,500 |
| #3 | 44102 | Detroit-Shoreway / Cudell | 78 | 11 | $115,000 | $115,000 |
| #4 | 44060 | Mentor | 73 | 6 | $220,000 | $253,750 |
| #5 | 44128 | Lee-Harvard / Warrensville | 62 | 9 | $66,646 | $132,000 |
| #6 | 44108 | Glenville | 59 | 11 | $50,000 | $78,000 |
| #7 | 44077 | Painesville | 65 | 3 | $193,000 | n/a |
| #8 | 44109 | Old Brooklyn | 55 | 11 | $95,000 | $140,000 |
A representative deal in each of the busiest zips
One deal per zip: the largest matching this market's typical house (typical for this market: 1357 sqft, 3 bed, built around 1949; priced within 4x the county assessment and under 5x its own zip's median).
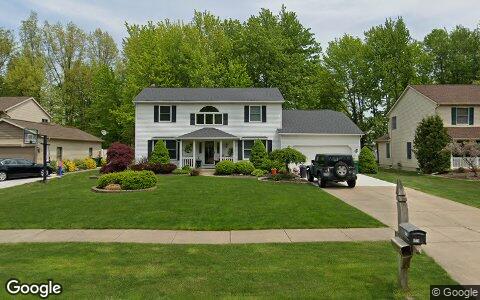
$490,000 · Purchase
6725 N PALMERSTON DR, Mentor 44060
Single family · 1,950 sqft · Jun 17
Street View May 2019 — before the purchase
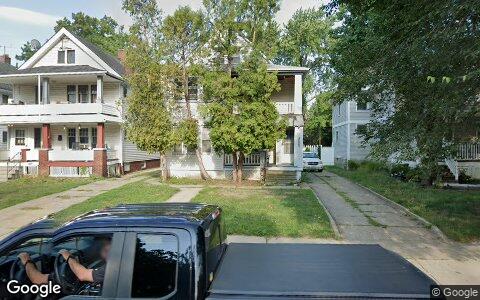
$360,000 · Purchase
1326 W 110TH ST, Cleveland 44102
2–4 unit · 2,120 sqft · May 26
Street View Aug 2022 — before the purchase
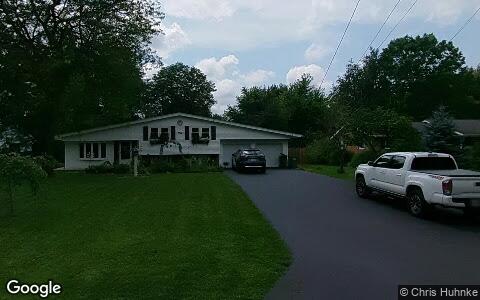
$326,000 · Purchase
74 MELROSE DR, Painesville 44077
Single family · 1,760 sqft · Jun 5
Street View Aug 2023 — before the purchase
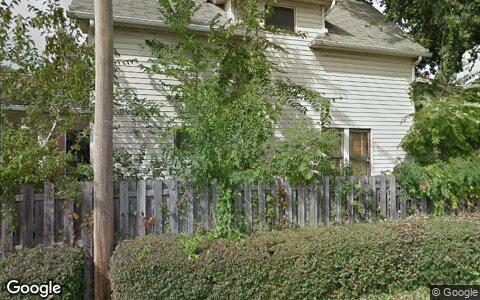
$225,000 · Purchase
2902 DENISON AVE, Cleveland 44109
Single family · 1,078 sqft · May 5
Street View Sep 2018 — before the purchase
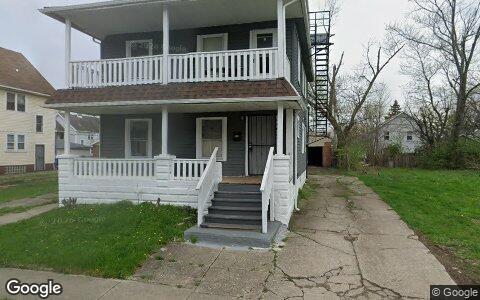
$197,700 · Purchase
3672 E 144TH ST, Cleveland 44120
2–4 unit · 2,160 sqft · Jun 18
Street View Apr 2026 — before the purchase
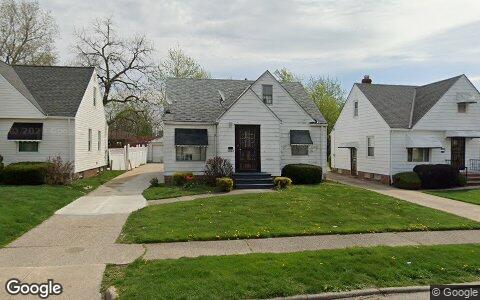
$180,000 · Purchase
4089 E 175TH ST, Cleveland 44128
Single family · 1,288 sqft · Jun 12
Street View Apr 2023 — before the purchase
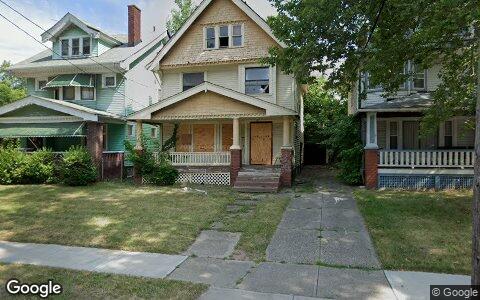
$170,000 · Purchase
9013 EMPIRE AVE, Cleveland 44108
Single family · 1,438 sqft · Jun 18
Street View Jul 2022 — before the purchase
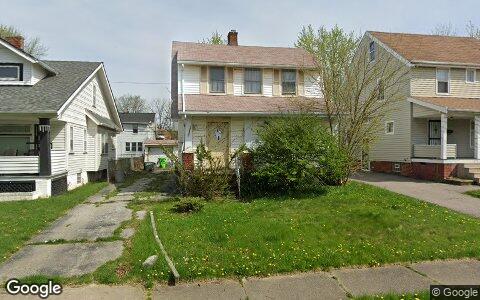
$159,900 · Purchase
13623 THORNHURST AVE, Garfield Heights 44105
Single family · 1,248 sqft · Jun 2
Street View Apr 2023 — before the purchase
Deal sheet — private lending, in date order
Private loans recorded against residential property this period, oldest first.
| Date | Lender | Amount | Property | Use |
|---|
| Jun 10 | Marshall Jeffrey | $36,000 | 5700 York DR, Cleveland 44124 | Condo |
| Jun 26 | Grill Brooke | $60,000 | 6468 Concord DR # L-5, Cleveland 44134 | Condo |
| Jun 29 | Kavalec Jim | $15,000 | 3363 Van Buren DR, Brunswick 44212 | Single family |
Largest flip margin deals of the period, at street level
Gross margin = recorded sale price minus the flipper's recorded purchase price. Purchase deeds are recoverable for roughly 4 in 10 flips; rehab and carry costs are not public record.
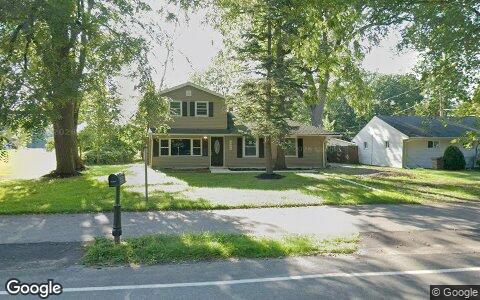
$280,000 gross · bought $100,000 (Aug 2024) → sold $380,000
5636 HOPKINS RD, Mentor 44060
Single family · 2,394 sqft · May 13
Street View Sep 2025 — during the flip
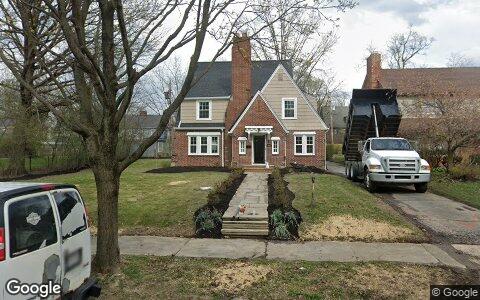
$270,000 gross · bought $215,000 (Nov 2025) → sold $485,000
3305 ENDERBY RD, Cleveland 44120
Single family · 2,023 sqft · Jun 4
Street View Apr 2026 — during the flip
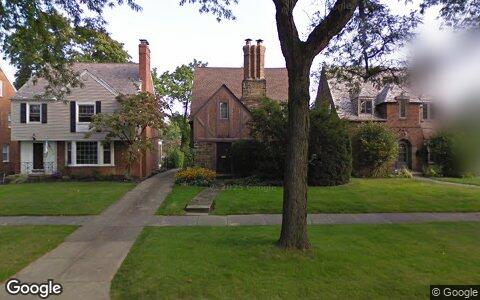
$269,000 gross · bought $130,000 (Aug 2024) → sold $399,000
18127 SCOTTSDALE BLVD, Shaker Heights 44122
Single family · 1,754 sqft · May 22
Street View Sep 2009 — before the flip (pre-renovation)
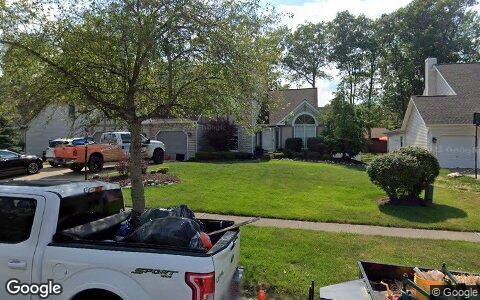
$253,000 gross · bought $315,000 (Feb 2026) → sold $568,000
18964 BEARS PAW LN, Strongsville 44136
Single family · 2,708 sqft · May 26
Street View Jul 2019 — before the flip (pre-renovation)
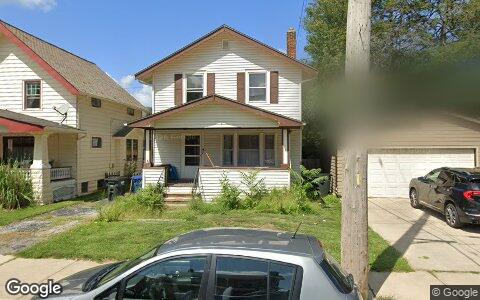
$230,000 gross · bought $140,000 (Nov 2025) → sold $370,000
17414 CANNON AVE, Lakewood 44107
Single family · 1,316 sqft · Jun 3
Street View Aug 2024 — before the flip (pre-renovation)
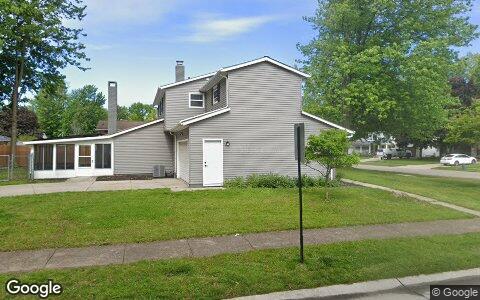
$220,000 gross · bought $170,000 (Aug 2025) → sold $390,000
36988 CLEARWAY DR, Eastlake 44095
Single family · 1,224 sqft · May 11
Street View May 2026 — during the flip
Flip Structure — Year over Year
How the flip market itself is changing: margins, who is doing the flipping, what they flip, and where. Same two calendar months, this year vs last, from the current data extract.
| Flip market structure | Same months last year | This edition |
|---|
| Flips sold | 604 | 285 |
| Median sale | $179,950 | $185,000 |
| Median $/sqft | $133 | $133 |
| Sale vs county-assessed | 1.50× | 1.44× |
| Median gross margin (matched buys) | $79,250 | $82,900 |
| Median margin % | 88% | 81% |
| Median hold | 6.4 mo | 6.3 mo |
| Homes bought by flippers | 740 | 430 |
| Net to inventory (bought − sold) | +136 | +145 |
| Active flippers | 408 | 221 |
| Top-10 flippers' revenue share | 21% | 18% |
| Median house: sqft / beds / built | 1394 / 3 / 1942 | 1375 / 3 / 1941 |
| Pre-1950 stock share | 57% | 60% |
| 2–4 unit share | 15% | 18% |
| Median distance from downtown | 14.5 km | 13.3 km |
Homes bought counts every deed recorded to a known flipper in the window, resold or not. Net to inventory is that minus flips sold. The standing stock is in the Flip Pipeline section.
Attributed profit per flip (per-investor aggregates, by drop period): Jul 25→Feb 26: 893 flips, $262,099/flip · Feb 26→Jun 26: 765 flips, $169,294/flip · Jun 26→Aug 26: 228 flips, $63,689/flip.
County mix (share of flips, last year → this edition): Cuyahoga 74%→72% · Lorain 13%→13% · Lake 7%→9% · Medina 4%→6% · Geauga 2%→1%.
Biggest zip share moves: Shaker Square / Buckeye 2.5%→6.3% · Maple Heights 3.0%→0.0% · Detroit-Shoreway / Cudell 1.7%→3.9% · Elyria 3.5%→1.4% · Collinwood 4.0%→2.5%.
Flip Pipeline — Buying, Selling and Inventory
Homes bought by known flippers and homes they resold, per month, alongside the stock sitting in flipper hands. A house enters inventory when a flipper buys it and leaves on the next recorded sale, at any price. Purchases still unsold after five years are treated as holds and drop out.
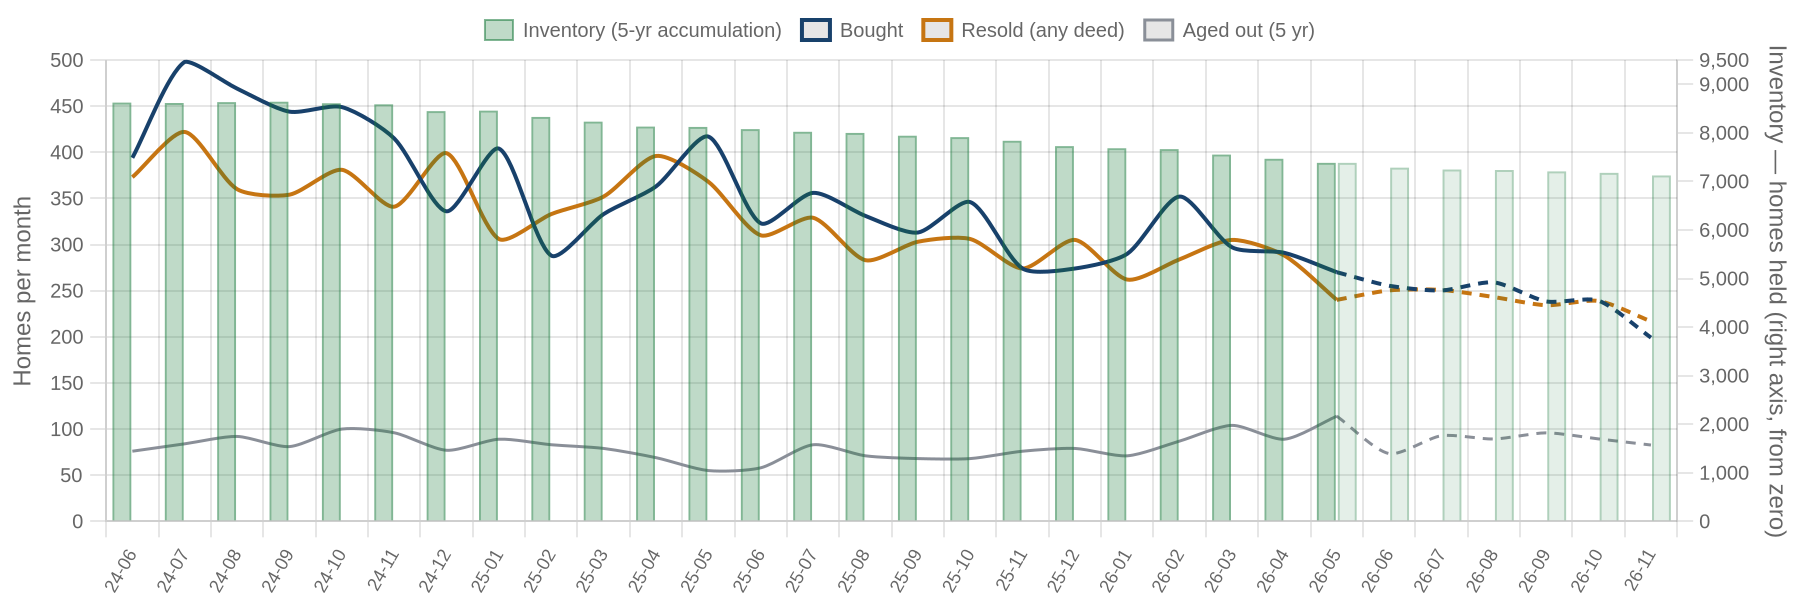
Solid = recorded, dashed = projected. Green bars are inventory on the right axis: homes bought and not yet resold. Aged out is purchases passing five years unsold. Inventory moves by bought minus resold minus aged out.
| Flip pipeline | Bought / mo | Resold / mo | Aged out / mo | Inventory |
|---|
| Latest recorded month (2026-05) | 270 | 240 | 114 | 7,382 |
| Projected (2026-11) | 199 | 217 | 83 | 7,123 |
Method: a straight-line trend through the last 24 months, adjusted for the month of the year, shown dashed as a projection. The series stops before the newest month or two, where deeds are still recording.
Who's Funding the Deals
First mortgages open on flipper purchases from Jul 2025 – Jun 2026 that have not yet resold. 54% carried recorded debt; the rest closed cash or off-record. Ranked by deal count.
54%
Purchases financed
1,234 of 2,298 flipper purchases carried a recorded first mortgage
$110,200
Typical loan
median 1.07× the purchase price — the median lender advances rehab money on top of the buy
56%
Funding the rehab too
693 of 1,234 loans exceed the purchase price, so the lender is covering work as well as the buy
| Lender | Loans | Borrowers | Median loan | Loan vs price | Funds rehab | Median purchase |
|---|
| Kiavi Funding INC | 77 | 36 | $150,500 | 1.30× | 84% | $129,700 |
| RFLF 4 LLC | 61 | 29 | $166,000 | 1.35× | 95% | $115,000 |
| MA6 LLC | 38 | 15 | $125,500 | 1.56× | 84% | $70,500 |
| Crosscountry Mortgage LLC | 29 | 26 | $186,558 | 0.97× | 24% | $188,000 |
| Argent Mortgage Company LLC | 25 | 18 | $82,650 | 1.34× | 80% | $61,400 |
| The Huntington National Bank | 15 | 12 | $73,150 | 0.90× | 13% | $80,667 |
| Howard Hanna Mortgage Services | 14 | 14 | $140,425 | 0.89× | 29% | $159,000 |
| Quicken Loans INC | 14 | 14 | $77,424 | 0.66× | 7% | $116,800 |
| Reo GB LLC | 13 | 5 | $182,700 | 1.50× | 77% | $112,000 |
| National City Bank | 12 | 9 | $42,500 | 0.92× | 42% | $47,500 |
Rates and terms are not published: the county feed models both. Borrowers counts the distinct flippers on each lender's book. Loan vs price is the recorded first mortgage divided by what the buyer paid. Above 1.00x the lender is funding purchase plus rehab; below it the buyer brought cash to the table. Blanket mortgages covering several parcels are excluded, as are loans outside 0.1x-3x the price. Rates and points are not public record.
Flipper Profile — The Working Flipper
The 70th–90th percentile of local flippers by lifetime flip count — the established operators below the whales: 3–8 lifetime flips each. Bath counts are not in the assessor extract.
423
Flippers in the band
each with 3–8 lifetime flips (avg 4.2)
$82,100
Median gross margin
3,310 flips matched to their purchase price
5.2 mo
Typical hold
purchase to resale, matched deals
1357 sqft · 3 bd
Typical house
median year built 1949
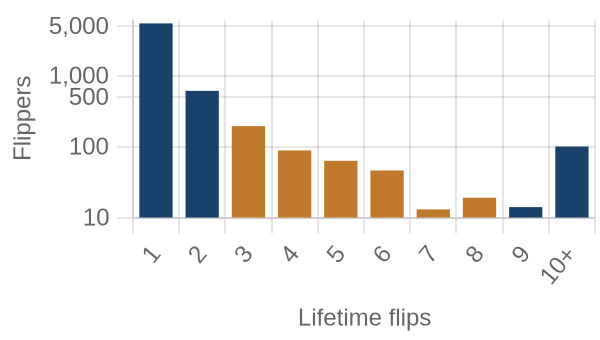
flippers by lifetime flips · orange = this band
Where they work: Lee-Harvard / Warrensville (44128) 5% · Slavic Village / Union-Miles (44105) 5% · Detroit-Shoreway / Cudell (44102) 4% · Old Brooklyn (44109) 4% · Shaker Square / Buckeye (44120) 3%.
Market Pulse
| per month, Jul 2025–Feb 2026 | per month, Jun–Aug 2026 | change | avg/mo 2yr | avg/mo 4yr |
|---|
| ▼ Homes bought by flippers | 370 | 215 | -42% | 355 | 387 |
| ▼ Flips sold (deeds) | 302 | 143 | -53% | 328 | 337 |
| ▼ Lending deals funded | 61 | 59 | -5% | — | — |
| ▲ Seller/notes held (net) | 189 | 234 | +24% | — | — |
| ▼ Investors (net) | 291 | 148 | -49% | — | — |
Flips and flipper purchases = recorded deeds, same two months each year; their 2- and 4-year columns are per-month averages of the deed series. The remaining rows come from the investor file, which spans 13 months, so they have no multi-year average (2026: Jun 2026 → Aug 2026; 2025: Jul 2025 → Feb 2026).
Past Issues
Methodology
Source Data
County recorder & assessor via FARES
Every figure is computed from recorded instruments (deeds, mortgages, assignments) and assessor property records for the five counties of the Cleveland-Elyria MSA. No surveys, no estimates, no listings data.
This edition analyzes transactions dated May 1 – June 30, 2026, as recorded through the 2026-08 data extract.
Who Counts as an Investor
Transaction-pattern identification
Investors are entities whose recorded transaction history looks like investing: rental holding (landlords), short-hold resales (flippers), private mortgage lending, note holding, or contract assignment (wholesalers). Banks, homebuilders, iBuyers, SFR funds, and government entities are identified by name and reported separately from small investors.
How Comparisons Work
Attribution deltas + same-window comparisons
The Market Pulse reports activity attributed between successive data drops, from the per-investor lifetime totals maintained upstream — periods differ in length, so per-month rates are shown. Elsewhere, "vs. year ago" compares the same calendar months one year earlier, counted from the same data extract. Transfers under $5,000 (quitclaims, partial interests) are excluded everywhere. Counts lag recording by 4–8 weeks, and the newest month can grow up to ~15% as late records arrive — direction is reliable before magnitude.
Known Limits
Floors, not ceilings
Wholesale assignments only appear when they touch a recorded deed, so those counts are a floor. Flip hold times are measured from the prior recorded sale. Names are the owner of record, which may be an LLC or trust.
About
Purpose
A working tool for small real estate investors in Greater Cleveland: what actually closed, where, at what prices, and what it suggests checking next — one theme per issue.
Cadence
Published with each bi-monthly data drop, covering the two most recent complete months of recorded activity.
Disclaimer
Observations from public records, not investment, legal, or tax advice. Past activity does not guarantee future results. Verify any property or counterparty independently before transacting.