This Issue
August 2026 edition
28.0 km vs 19.1 km
Median distance from the Austin CBD of homes flippers resold this edition, against the same measure a year ago
Flip exits moved out of Travis County: Williamson took 32% of resales against 16% a year ago, and the median exit sat 28.0 km from downtown versus 19.1 km
Fifty-three flips were recorded sold this edition against 68 a year ago, and their map moved outward. Travis County held 49% of resales versus 65% a year ago while Williamson doubled to 32% from 16%; the median exit sat 28.0 km from the CBD against 19.1 km. Georgetown West (78628) alone carried 7.5% of exits after none a year ago, and Spicewood (78669) 5.7%. Hold time on those exits ran a median 162 days, down from 231.5. Dollar figures here are estimates; the recorded geography, counts and hold times are the story.
Investor Playbook
What this issue's numbers suggest checking, by investor type. Observations from recorded data — not investment, legal, or tax advice.
Follow the buyer list to Williamson, not the buy count to Bastrop
Wholesalers
Buy volume is heaviest in 78602 Bastrop (38 recorded purchases, 0 flips) and 78621 Elgin (30 buys, 1 flip), but flip exits are clustering in 78628 Georgetown West (33 buys, 4 flips) and 78664 Round Rock (28 buys, 3 flips). With only 12 assignments surfacing this edition against 28 a year ago, the data suggests building the buyer side around the 36 operators still recording exits rather than broadcasting to a wide list.
Test the outer ring your competitors are already exiting in
Flippers
Travis fell to 49% of recorded resales from 65%, Williamson rose to 32% from 16%, and the median exit is 28.0 km from the CBD. Median hold on completed exits was 162 days versus 231.5. Worth checking whether your rehab scope and estimated basis in 78628 and 78669 pencil at a 5-month turn; margins are gross of rehab and carry, and roughly 46% of the dollar figures here are back-computed from the recorded mortgage.
Small multi and manufactured stock stayed thin on the recorded tape
Landlords
Only 32 recorded 2-4 unit purchases and 30 mobile/manufactured purchases cleared this edition, against 505 single-family. Recorded medians in Kyle (78640, 31 buys), Elgin (78621, 30) and Bastrop (78602, 38) are estimated near or below $210,000 — the lowest of the busiest zips. With 1,415 local landlords adding units since the last drop, sourcing off-tape rather than competing on the same eight zips is worth considering.
Fill the rehab slot that recorded private paper has vacated
Private lenders
Recorded private loans fell to 30 from 156 a year ago, and only 36.7% of the 720 observed investor purchases in the trailing twelve months carried a recorded loan. Of the 264 financed purchases, 62% involved rehab-stage funding at a median loan of roughly $324,022. The gap sits with the outer-ring flip cohort now turning in about 162 days; note that rates and terms are not recorded and are not published here.
2-4 unit basis per foot still prices under single family
Multifamily investors
The 32 recorded 2-4 unit purchases carried an estimated $214/sqft against $251/sqft on single family and $250/sqft on condos, on an estimated median of about $446,134. Small multi made up 5.7% of flips resold, down from 8.8% a year ago, so fewer renovated small-multi exits are competing for the same buyer. Treat every per-foot figure as an estimate.
Factoids
Numbers from this period a practitioner would repeat to a colleague. Each computed directly from recorded instruments.
93% of flip revenue from ten operators — Top-10 share of recorded flip resale revenue this edition
trending up · vs 38% a year ago
Only 36 distinct operators recorded a flip resale this edition, against 56 a year ago. Exit activity is being carried by a much shorter list of names, so a single builder-scale seller can move the medians.
162 days median hold — Median days held on flips resold this edition
trending down · vs 231.5 days a year ago
Recorded hold time compressed by roughly ten weeks year over year, with 25% of measurable exits turning in under 90 days. Faster turns lower carry exposure but leave less room for a full rehab scope.
882 investor purchases — Recorded investor purchases this edition
trending down · vs 1,064 a year ago; 880 in the prior period
Acquisition volume is flat against the prior period but down 17% year over year. The most recent month can still grow up to about 15% as late instruments record.
216 residential lot purchases — Vacant residential land as a share of the 882 recorded investor purchases
holding steady · vs 505 single-family purchases
Land is the second-largest recorded product type this edition, ahead of condos at 86 and 2-4 units at 32. Lot buying concentrates in the outer-ring zips where flip exits are now clustering.
30 private loans recorded — Recorded private-lender loans this edition
trending down · vs 156 a year ago; 36 in the prior period
Recorded private credit has thinned to a fraction of last year's count while seller-financed notes also fell to 155 from 239. Deals are closing on fewer recorded third-party instruments.
12 wholesale assignments — Assignments that surfaced on a recorded deed this edition
trending down · vs 28 a year ago; 18 in the prior period
This is a floor — most assignments never touch a deed — but the direction matches the drop in flip resales. Fewer paper exits are reaching the recorder.
Market Activity — Investor Purchases
Monthly count of investor purchases of MSA properties (left axis) and the median purchase price (right axis), trailing 13 months. The most recent month can grow up to ~15% as late recordings arrive.
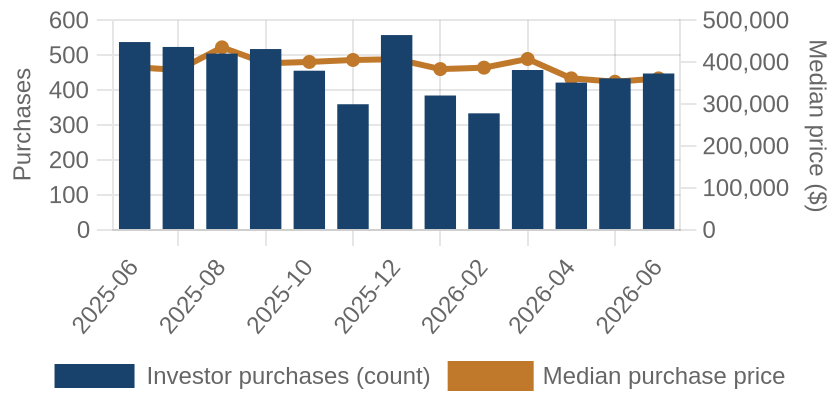
Investor purchases per month (bars) and median purchase price (line), trailing 13 months.
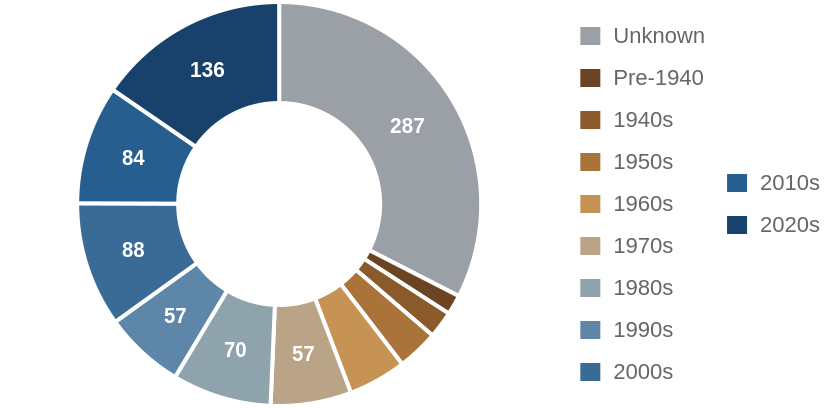
Which vintage of housing investors bought this edition, by decade built.
Where the Money Went
The geography of the period's investor activity: which zip codes saw the most recorded deals, and the largest individual transactions at street level.
The 8 busiest zip codes for investor deals
Pins rank the busiest zips by recorded investor deals (purchases + flips of existing homes) this period — #1 busiest; orange = top 3; pin size scales with deal volume. Median buy is the typical investor purchase; median sale the typical flip resale. Click a pin for details; full table below.
| # | Zip | Area | Purchases | Flips | Median buy | Median sale |
|---|
| #1 | 78745 | South Austin / Westgate | 37 | 3 | $448,210 | n/a |
| #2 | 78602 | Bastrop | 38 | 0 | $196,540 | n/a |
| #3 | 78628 | Georgetown West | 33 | 4 | $379,050 | n/a |
| #4 | 78641 | Leander | 34 | 1 | $410,822 | n/a |
| #5 | 78640 | Kyle | 31 | 3 | $188,700 | n/a |
| #6 | 78621 | Elgin | 30 | 1 | $205,332 | n/a |
| #7 | 78664 | Round Rock | 28 | 3 | $299,294 | n/a |
| #8 | 78634 | Hutto | 27 | 1 | $327,559 | n/a |
Dollar figures on this page are estimates. This county does not disclose sale prices, so 46% of them are back-computed from the recorded mortgage at an assumed loan-to-value. Treat every price, margin and per-foot figure as indicative. Counts, dates, hold times, parties and geography come from the deed record itself and are unaffected.
A representative deal in each of the busiest zips
One deal per zip: the largest matching this market's typical house (typical for this market: 1827 sqft, 3 bed, built around 1995; priced within 4x the county assessment and under 5x its own zip's median).
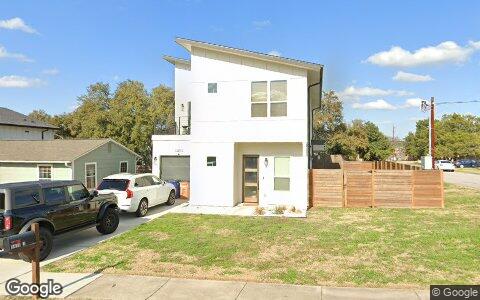
$806,239 · Purchase
3410 DALTON ST APT 1, Austin 78745
Condo · 1,751 sqft · May 15
Street View Feb 2025 — before the purchase
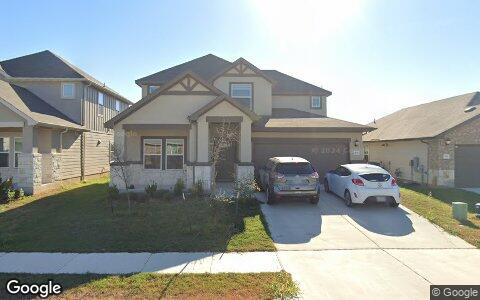
$579,268 · Purchase
206 WIND TRL, Hutto 78634
Single family · 2,645 sqft · Jun 9
Street View Sep 2024 — before the purchase
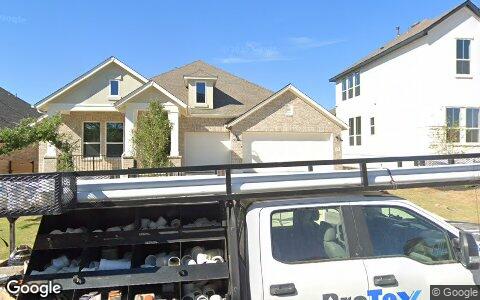
$556,629 · Purchase
208 SPRINGHOUSE RD, Georgetown 78628
Single family · 2,461 sqft · May 15
Street View Apr 2024 — before the purchase
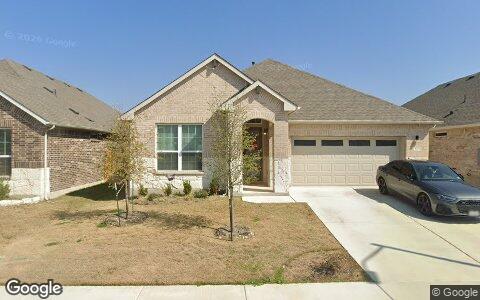
$350,800 · Purchase
420 MOUNTAIN SKY BND, Leander 78641
Single family · 2,431 sqft · May 12
Street View Feb 2025 — before the purchase
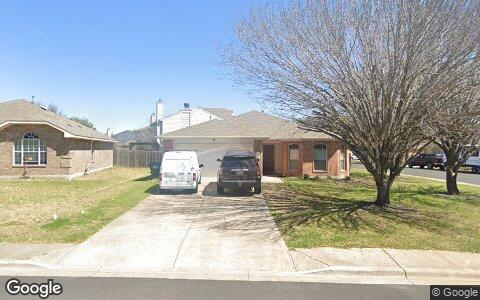
$276,972 · Purchase
121 PRIMROSE BLVD, Kyle 78640
Single family · 1,654 sqft · Jun 17
Street View Mar 2022 — before the purchase
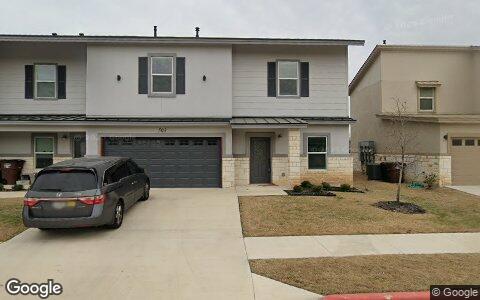
$268,128 · Purchase
2105 TIGER TRL UNIT 503, Round Rock 78664
Condo · 2,221 sqft · May 21
Street View Feb 2024 — before the purchase
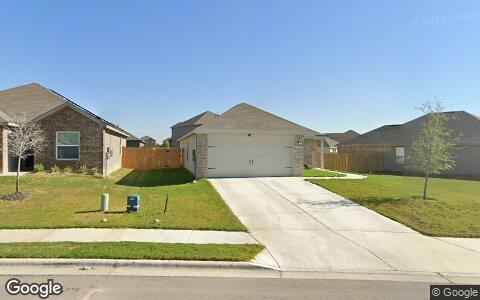
$155,500 · Purchase
13028 TORREY REYNOLDS DR, Elgin 78621
Single family · 1,520 sqft · May 14
Street View Oct 2024 — before the purchase
Deal sheet — private lending, in date order
Private loans recorded against residential property this period, oldest first.
| Date | Lender | Amount | Property | Use |
|---|
| May 6 | Huynh Truc | $313,000 | 20403 Phebe Foster ST, Manor 78653 | Single family |
| May 18 | Franke Brian | $535,000 | 6704 Duquesne DR, Austin 78723 | Single family |
| Jun 22 | Hawthorne Rodney | $580,000 | 6004 Whipple Way, Austin 78745 | Condo |
| Jun 23 | Two Squared LLC | $600,000 | 307 Sumalt Gap Way, Austin 78738 | Single family |
| Jun 24 | Chavez Jose | $199,000 | 11620 Carbrook RD, Manor 78653 | Single family |
Largest flip margin deals of the period, at street level
Gross margin = recorded sale price minus the flipper's recorded purchase price. Purchase deeds are recoverable for roughly 4 in 10 flips; rehab and carry costs are not public record.
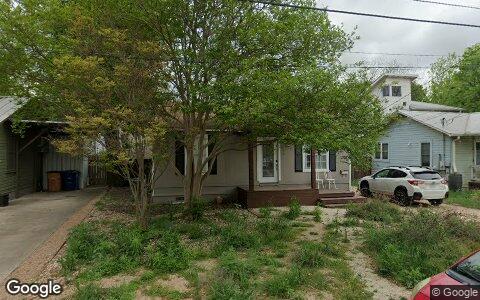
$1.2M gross · bought $605,150 (Aug 2025) → sold $1.8M
1901 MADISON AVE, Austin 78757
Single family · 820 sqft · May 29
Street View Mar 2024 — before the flip (pre-renovation)
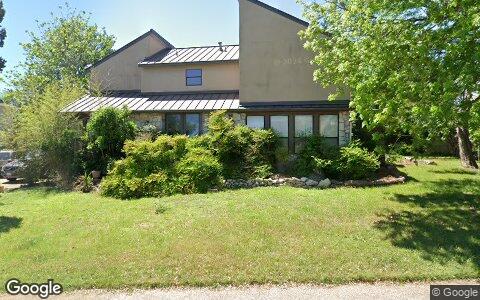
$604,618 gross · bought $791,350 (Dec 2025) → sold $1.4M
5705 RAIN CREEK PKWY, Austin 78759
Single family · 2,630 sqft · Jun 9
Street View Apr 2024 — before the flip (pre-renovation)

$479,395 gross · bought $560,000 (May 2026) → sold $1.0M
14039 TIMBERLINE TRL, Austin 78737
Single family · 3,090 sqft · May 20
Street View Mar 2025 — before the flip (pre-renovation)
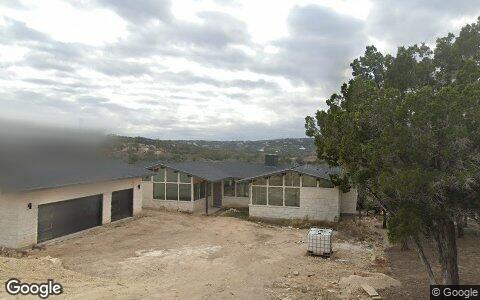
$447,654 gross · bought $600,000 (Feb 2024) → sold $1.0M
19543 LAKEHURST LOOP, Spicewood 78669
Single family · 2,926 sqft · May 12
Street View Jan 2025 — during the flip
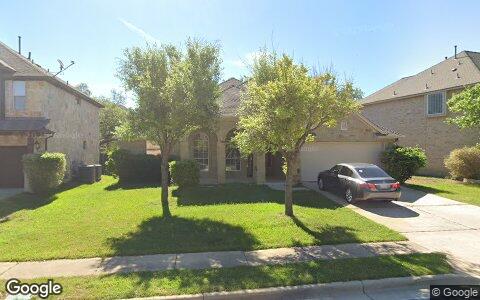
$421,632 gross · bought $330,616 (Jan 2026) → sold $752,248
9721 RIAS WAY, Austin 78717
Single family · 2,521 sqft · May 1
Street View Apr 2024 — before the flip (pre-renovation)
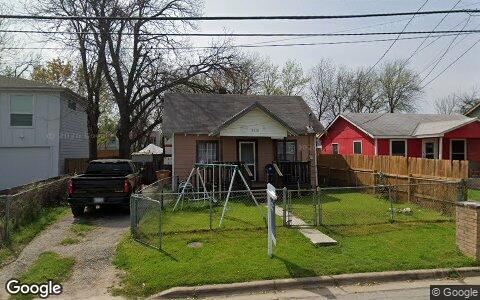
$239,732 gross · bought $562,590 (Sep 2024) → sold $802,322
2515 GONZALES ST, Austin 78702
Single family · 744 sqft · May 29
Street View Mar 2024 — before the flip (pre-renovation)
Flip Structure — Year over Year
How the flip market itself is changing: margins, who is doing the flipping, what they flip, and where. Same two calendar months, this year vs last, from the current data extract.
| Flip market structure | Same months last year | This edition |
|---|
| Flips sold | 68 | 53 |
| Median sale | $535,831 | $480,861 |
| Median $/sqft | $299 | $253 |
| Sale vs county-assessed | 1.23× | 1.00× |
| Median gross margin (matched buys) | $121,000 | $83,790 |
| Median margin % | 26% | 26% |
| Median hold | 7.6 mo | 5.3 mo |
| Homes bought by flippers | 156 | 168 |
| Net to inventory (bought − sold) | +88 | +115 |
| Active flippers | 56 | 36 |
| Top-10 flippers' revenue share | 38% | 93% |
| Median house: sqft / beds / built | 1951 / 4 / 1999 | 1932 / 3 / 1995 |
| Pre-1950 stock share | 1% | 6% |
| 2–4 unit share | 9% | 6% |
| Median distance from downtown | 19.1 km | 28.0 km |
Dollar figures on this page are estimates. This county does not disclose sale prices, so 46% of them are back-computed from the recorded mortgage at an assumed loan-to-value. Treat every price, margin and per-foot figure as indicative. Counts, dates, hold times, parties and geography come from the deed record itself and are unaffected.
Homes bought counts every deed recorded to a known flipper in the window, resold or not. Net to inventory is that minus flips sold. The standing stock is in the Flip Pipeline section.
Attributed profit per flip (per-investor aggregates, by drop period): Jul 25→Feb 26: 3,658 flips, $1.5M/flip · Feb 26→Jun 26: 915 flips, n/a (revisions) · Jun 26→Aug 26: 321 flips, n/a (revisions).
County mix (share of flips, last year → this edition): Travis 65%→49% · Williamson 16%→32% · Hays 16%→13% · Caldwell 1%→4% · Bastrop 1%→2%.
Biggest zip share moves: Georgetown West 0.0%→7.5% · Spicewood 0.0%→5.7% · Round Rock 1.5%→5.7% · Lago Vista 5.9%→1.9% · South Austin / Shady Hollow 5.9%→1.9% · Buda 5.9%→1.9%.
Flip Pipeline — Buying, Selling and Inventory
Homes bought by known flippers and homes they resold, per month, alongside the stock sitting in flipper hands. A house enters inventory when a flipper buys it and leaves on the next recorded sale, at any price. Purchases still unsold after five years are treated as holds and drop out.
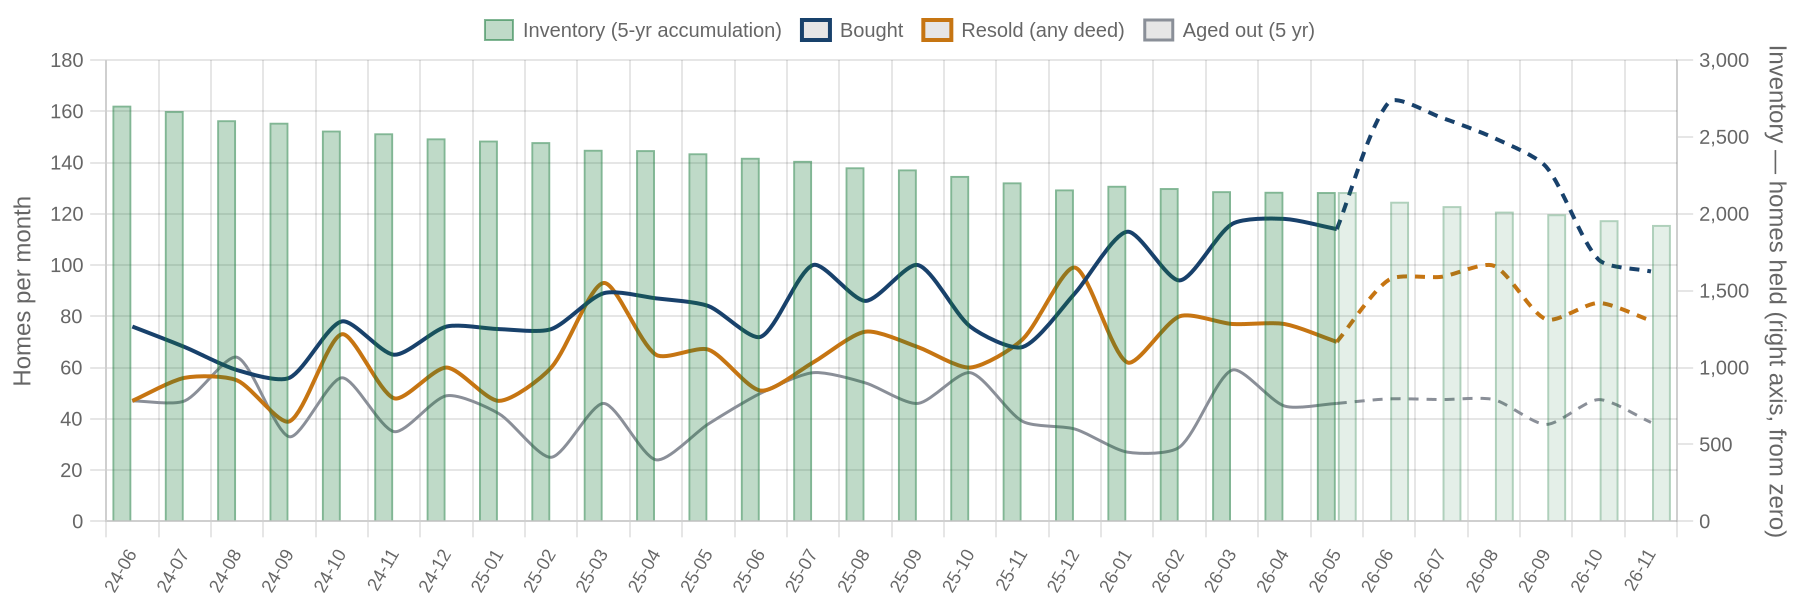
Solid = recorded, dashed = projected. Green bars are inventory on the right axis: homes bought and not yet resold. Aged out is purchases passing five years unsold. Inventory moves by bought minus resold minus aged out.
| Flip pipeline | Bought / mo | Resold / mo | Aged out / mo | Inventory |
|---|
| Latest recorded month (2026-05) | 114 | 70 | 46 | 2,141 |
| Projected (2026-11) | 98 | 78 | 39 | 1,927 |
Method: a straight-line trend through the last 24 months, adjusted for the month of the year, shown dashed as a projection. The series stops before the newest month or two, where deeds are still recording.
Who's Funding the Deals
First mortgages open on flipper purchases from Jul 2025 – Jun 2026 that have not yet resold. 37% carried recorded debt; the rest closed cash or off-record. Ranked by deal count.
37%
Purchases financed
264 of 720 flipper purchases carried a recorded first mortgage
$324,022
Typical loan
recorded lien amount; this county does not disclose sale prices, so loan-to-price cannot be computed here
| Lender | Loans | Borrowers | Median loan | Median purchase |
|---|
| United Wholesale Mortgage LLC | 12 | 11 | $312,862 | $301,532 |
| Rocket Mortgage LLC | 8 | 7 | $250,600 | $272,050 |
| Mortgage Research Center LLC | 7 | 7 | $480,000 | $470,400 |
| Dhi Mortgage Company, LTD. | 6 | 4 | $365,800 | $253,850 |
| Kiavi Funding INC | 6 | 3 | $210,000 | $221,000 |
| CMG Mortgage INC | 5 | 5 | $481,040 | $471,419 |
| Fairway Independent MTG Corp | 5 | 5 | $441,849 | $302,208 |
| Lendz Financial | 5 | 1 | $202,150 | $271,320 |
| Loandepotcom LLC | 5 | 5 | $497,000 | $324,500 |
| Nexus Series B LLC | 5 | 1 | $725,000 | $350,000 |
Dollar figures on this page are estimates. This county does not disclose sale prices, so 46% of them are back-computed from the recorded mortgage at an assumed loan-to-value. Treat every price, margin and per-foot figure as indicative. Counts, dates, hold times, parties and geography come from the deed record itself and are unaffected.
Rates and terms are not published: the county feed models both. Borrowers counts the distinct flippers on each lender's book. Loan vs price is the recorded first mortgage divided by what the buyer paid. Above 1.00x the lender is funding purchase plus rehab; below it the buyer brought cash to the table. Blanket mortgages covering several parcels are excluded, as are loans outside 0.1x-3x the price. Rates and points are not public record.
Flipper Profile — The Working Flipper
The 70th–90th percentile of local flippers by lifetime flip count — the established operators below the whales: 3–8 lifetime flips each. Bath counts are not in the assessor extract.
565
Flippers in the band
each with 3–8 lifetime flips (avg 4.1)
$92,435
Median gross margin
645 flips matched to their purchase price
6.2 mo
Typical hold
purchase to resale, matched deals
1827 sqft · 3 bd
Typical house
median year built 1995
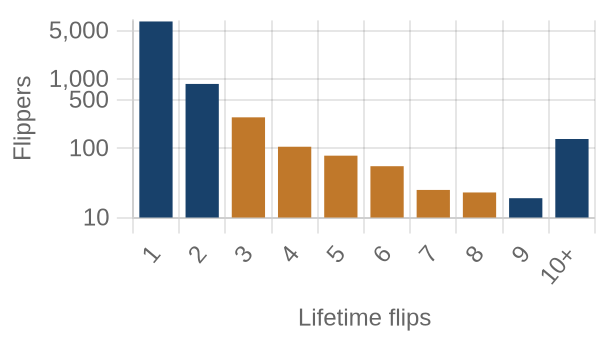
flippers by lifetime flips · orange = this band
Where they work: South Austin / Westgate (78745) 7% · Mueller / Windsor Park (78723) 4% · Bastrop (78602) 4% · Lago Vista (78645) 3% · Manor (78653) 3%.
Market Pulse
| per month, Jul 2025–Feb 2026 | per month, Jun–Aug 2026 | change | avg/mo 2yr | avg/mo 4yr |
|---|
| ▲ Homes bought by flippers | 78 | 84 | +8% | 85 | 78 |
| ▼ Flips sold (deeds) | 34 | 27 | -22% | 65 | 64 |
| ▼ Lending deals funded | 304 | 92 | -70% | — | — |
| ▼ Seller/notes held (net) | 953 | 309 | -68% | — | — |
| ▲ Investors (net) | -897 | 446 | +1,343/mo | — | — |
Flips and flipper purchases = recorded deeds, same two months each year; their 2- and 4-year columns are per-month averages of the deed series. The remaining rows come from the investor file, which spans 13 months, so they have no multi-year average (2026: Jun 2026 → Aug 2026; 2025: Jul 2025 → Feb 2026).
Past Issues
Methodology
Source Data
County recorder & assessor via FARES
Every figure is computed from recorded instruments (deeds, mortgages, assignments) and assessor property records for the five counties of the Austin-Round Rock-Georgetown MSA. No surveys, no estimates, no listings data.
This edition analyzes transactions dated May 1 – June 30, 2026, as recorded through the 2026-08 data extract.
Who Counts as an Investor
Transaction-pattern identification
Investors are entities whose recorded transaction history looks like investing: rental holding (landlords), short-hold resales (flippers), private mortgage lending, note holding, or contract assignment (wholesalers). Banks, homebuilders, iBuyers, SFR funds, and government entities are identified by name and reported separately from small investors.
How Comparisons Work
Attribution deltas + same-window comparisons
The Market Pulse reports activity attributed between successive data drops, from the per-investor lifetime totals maintained upstream — periods differ in length, so per-month rates are shown. Elsewhere, "vs. year ago" compares the same calendar months one year earlier, counted from the same data extract. Transfers under $5,000 (quitclaims, partial interests) are excluded everywhere. Counts lag recording by 4–8 weeks, and the newest month can grow up to ~15% as late records arrive — direction is reliable before magnitude.
Known Limits
Floors, not ceilings
Wholesale assignments only appear when they touch a recorded deed, so those counts are a floor. Flip hold times are measured from the prior recorded sale. Names are the owner of record, which may be an LLC or trust.
About
Purpose
A working tool for small real estate investors in the Austin metro: what actually closed, where, at what prices, and what it suggests checking next — one theme per issue.
Cadence
Published with each bi-monthly data drop, covering the two most recent complete months of recorded activity.
Disclaimer
Observations from public records, not investment, legal, or tax advice. Past activity does not guarantee future results. Verify any property or counterparty independently before transacting.